Difference between revisions of "Analytics Data Model"
(Tag: Visual edit) |
(→Data Model) (Tag: Visual edit) |
||
| (25 intermediate revisions by 2 users not shown) | |||
| Line 1: | Line 1: | ||
== Data Model == | == Data Model == | ||
| − | The Data Model is divided into | + | The Analytics Data Model is divided into 4 sections: |
| − | # '''Productivity Data Model''' | + | # '''Productivity by Shift Data Model''' |
| − | # ''' | + | # '''Part Data by Shift Data Model''' |
| − | # ''' | + | # '''Productivity by Hour Data Model''' |
| + | # '''Checklists Data Model''' | ||
| − | === Productivity Data Model === | + | === '''Productivity by Shift Data Model''' === |
| − | MInt Productivity data, that is data about performance | + | MInt Productivity data, that is data about performance. This data is rolled up at the shift level for shift level productivity analysis. |
| − | |||
Here is a diagram that represents the data model. | Here is a diagram that represents the data model. | ||
| + | [[File:MINT Analytics Data Model - ProductivityByShift.png|none|thumb|500x500px|MINT Analytics Data Model - WorkCenterShiftFact]] | ||
| + | The main tables are: | ||
| − | + | '''ProductivityByShift'':''''' Productivity data is centred around a 'workcenter' (essentially a machine that is performing the task). This table contains the primary shift-level productivity parameters. | |
| − | + | '''DowntimeByShift''': Downtime represents the time duration for which the machine was non-operational. This table contains information about durations and reasons for the downtimes of a workcenter for a given shift. | |
| − | '''''' | + | '''RejectionsByShift''': Rejections are the quality defects that occurred on a workcenter. The table contains information about these quality rejections for a workcenter for a shift and the reasons for it. |
| − | + | '''OperatorsByShift''': This table contains information about the operators working on the workcenter for a given shift. | |
| − | ''' | + | '''ProductivityDowntimeByShift''': Performance loss is the metric to highlight the less-than-ideal rate at which the machine was working. If the machine is working slower than the expected (ideal) rate, the user can book a performance loss and associate a reason for it. This table contains the performance loss downtime information. |
| − | ''' | + | '''ProductionParametersByShift''': The table contains Production parameter data at a shift level. Production parameters are used to store the production quantity in different units based on customer requirements. |
| − | ' | + | e.g. Some customers want to measure production quantity in Batch Counts but for their internal assessment, they need Batch Weight. In such cases, MInt will show Batch Count and Batch Weight will be sent to their internal system (say the customer's ERP system). |
| − | ''' | + | '''UtilitiesByShift:''' |
| − | + | Please refer to the following link for [[Data Model Column Descriptions|description of each table column]]. | |
| − | |||
| − | |||
| − | + | '''Examples of using the object model to create a chart:''' | |
| + | |||
| + | Here is an example video of how you can use the data model to analyze [[Create your own custom dashboards|average OEE by Workcenters]]. | ||
| + | |||
| + | {{#ev:youtube|https://youtu.be/n-W1frXyaJg}} | ||
| + | |||
| + | |||
| + | |||
| + | === '''Part Data by Shift Data Model''' === | ||
| + | MInt Part Productivity data gives insights about your part level performance. This data is rolled up at the shift level for doing shift level part productivity analysis. | ||
| + | |||
Here is a diagram that represents the data model. | Here is a diagram that represents the data model. | ||
| + | [[File:MINT Analytics Data Model - PartDataByShift.png|none|thumb|500x500px|MINT Analytics Data Model - PartDataByShift]] | ||
| + | The main tables are: | ||
| + | |||
| + | '''PartDataByShift:''' The Part Productivity data is centred around a part that is being produced on the workcenter. This table contains the primary shift level part productivity parameters. | ||
| + | |||
| + | '''PartDowntimeReasonsByShift:''' Downtime represents the time duration for which the machine was non-operational. This table contains information about the downtimes that occurred throughout the duration for which a part was booked within a shift and the reasons for those downtimes. | ||
| − | + | '''PartRejectionsByShift:''' Rejections are the quality defects that occurred on a workcenter. The table contains information about these quality rejections for a part for a shift and the reasons for it. | |
| − | + | '''PartProductionParametersByShift:''' The table contains Production parameter data at a part and shift level. Production parameters are used to store the production quantity in different units based on customer requirements. | |
| − | |||
| − | + | e.g. Some customers want to measure production quantity in Batch Counts but for their internal assessment, they need Batch Weight. In such cases, MInt will show Batch Count and Batch Weight will be sent to their internal system (say the customer's ERP system). | |
| − | |||
| − | ''' | + | '''WorkordersByShift:''' |
| − | |||
| − | + | '''Examples of using the object model to create a chart:''' | |
| − | + | Here is an example video of how you can use the data model to analyze Part Cycle Times by Shift. | |
| − | + | {{#ev:youtube|https://youtu.be/1V_oVQ-8Pfo}} | |
| − | |||
| − | |||
| − | + | === '''Productivity by Hour Data Model''' === | |
| + | MInt Hourly Data is aggregation of Condition Based Monitoring (CBM), Part Process Quality, and Performance. This data is rolled up at an hourly level. | ||
| − | + | Here is a diagram that represents the data model. | |
| + | [[File:MINT Analytics Data Model - ProductivityByHour.png|none|thumb|500x500px|MINT Analytics Data Model - ProductivityByHour]] | ||
| + | The main tables are: | ||
| − | ''' | + | '''ProductivityByHour:''' Productivity data is centred around a 'workcenter' (essentially a machine that is performing the task). This table contains the primary hourly level productivity parameters. |
| − | + | '''CbmParametersByHour:''' Condition Based Monitoring (CBM) is the process of monitoring a key parameter in a workcenter (vibration, temperature etc.). This helps in locating a significant change which may be indicative of a developing fault in a machine. The table contains information about the CBM parameters, their control limits and details of violations. | |
| − | + | '''ProcessParametersByHour:''' Process parameters are the parameters dependant on the part (temperature of Part-1, temperature of Part-2 etc.). This helps in identifying a significant change that may be indicative of developing a quality defect. The table contains information about the Process parameters, their control limits and details of violations. | |
| − | + | '''PartProcessOperationByHour:''' The table contains Part - Operation information for each part at an hourly level. | |
| − | |||
| − | + | '''*WorkcenterPartHourlyProdParamsFact:''' The table contains production parameter data at a part and hourly level. Production parameters are used to store the production quantity in different units based on Customer requirements. | |
| − | + | e.g. Some customers want to measure production quantity in Batch Counts but for their internal assessment, they need Batch Weight. In such cases, MInt will show Batch Count and Batch Weight will be sent to their internal system (say the customer's ERP system). | |
| − | + | '''UtilitiesByHour:''' | |
| − | + | '''OperationEnergyByHour:''' | |
| − | + | '''PartProductivityByHour:''' | |
| − | |||
| − | + | '''Examples of using the object model to create a chart:''' | |
| + | |||
| + | Here is an example video of how you can use the data model to analyze CBM Parameter Violations by Hour. | ||
| + | |||
| + | {{#ev:youtube|https://youtu.be/E5tlytK0tjo}} | ||
| + | |||
| + | |||
| + | |||
| + | === '''Checklists Data Model''' === | ||
| + | MInt Policy data gives information about your manual policy bookings. For e.g. Safety Checksheets, Part Dimension Checklists, etc. This data is then used for correlations with other process/ productivity parameters or to create dashboards from your manual booking data. | ||
| + | |||
| + | Here is a diagram that represents the data model. | ||
| + | [[File:MINT Analytics Data Model - Checklists data.png|none|thumb|500x500px|MINT Analytics Data Model - Checklists data]] | ||
| + | The main tables are: | ||
| + | |||
| + | '''Checklists:''' The table contains policy master data along with the schedule of the policy booking. | ||
| − | This data | + | '''ChecklistBooking:''' This table has the actual manually entered booking data for e.g. part length values, checklist values etc. |
Latest revision as of 06:12, 27 June 2021
Contents
Data Model
The Analytics Data Model is divided into 4 sections:
- Productivity by Shift Data Model
- Part Data by Shift Data Model
- Productivity by Hour Data Model
- Checklists Data Model
Productivity by Shift Data Model
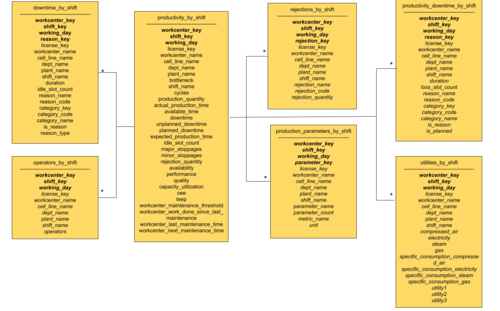
MInt Productivity data, that is data about performance. This data is rolled up at the shift level for shift level productivity analysis.
Here is a diagram that represents the data model.
The main tables are:
ProductivityByShift: Productivity data is centred around a 'workcenter' (essentially a machine that is performing the task). This table contains the primary shift-level productivity parameters.
DowntimeByShift: Downtime represents the time duration for which the machine was non-operational. This table contains information about durations and reasons for the downtimes of a workcenter for a given shift.
RejectionsByShift: Rejections are the quality defects that occurred on a workcenter. The table contains information about these quality rejections for a workcenter for a shift and the reasons for it.
OperatorsByShift: This table contains information about the operators working on the workcenter for a given shift.
ProductivityDowntimeByShift: Performance loss is the metric to highlight the less-than-ideal rate at which the machine was working. If the machine is working slower than the expected (ideal) rate, the user can book a performance loss and associate a reason for it. This table contains the performance loss downtime information.
ProductionParametersByShift: The table contains Production parameter data at a shift level. Production parameters are used to store the production quantity in different units based on customer requirements.
e.g. Some customers want to measure production quantity in Batch Counts but for their internal assessment, they need Batch Weight. In such cases, MInt will show Batch Count and Batch Weight will be sent to their internal system (say the customer's ERP system).
UtilitiesByShift:
Please refer to the following link for description of each table column.
Examples of using the object model to create a chart:
Here is an example video of how you can use the data model to analyze average OEE by Workcenters.
Part Data by Shift Data Model
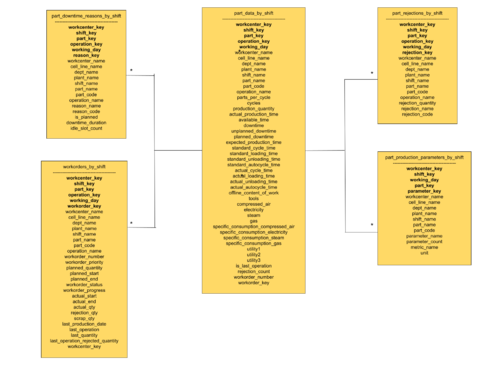
MInt Part Productivity data gives insights about your part level performance. This data is rolled up at the shift level for doing shift level part productivity analysis.
Here is a diagram that represents the data model.
The main tables are:
PartDataByShift: The Part Productivity data is centred around a part that is being produced on the workcenter. This table contains the primary shift level part productivity parameters.
PartDowntimeReasonsByShift: Downtime represents the time duration for which the machine was non-operational. This table contains information about the downtimes that occurred throughout the duration for which a part was booked within a shift and the reasons for those downtimes.
PartRejectionsByShift: Rejections are the quality defects that occurred on a workcenter. The table contains information about these quality rejections for a part for a shift and the reasons for it.
PartProductionParametersByShift: The table contains Production parameter data at a part and shift level. Production parameters are used to store the production quantity in different units based on customer requirements.
e.g. Some customers want to measure production quantity in Batch Counts but for their internal assessment, they need Batch Weight. In such cases, MInt will show Batch Count and Batch Weight will be sent to their internal system (say the customer's ERP system).
WorkordersByShift:
Examples of using the object model to create a chart:
Here is an example video of how you can use the data model to analyze Part Cycle Times by Shift.
Productivity by Hour Data Model
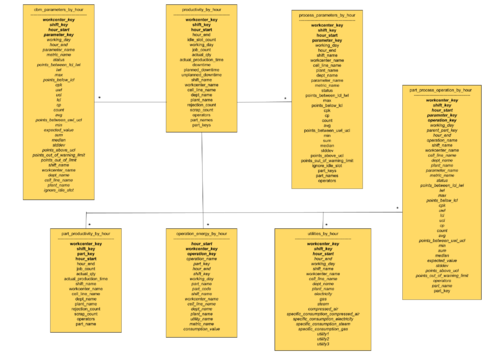
MInt Hourly Data is aggregation of Condition Based Monitoring (CBM), Part Process Quality, and Performance. This data is rolled up at an hourly level.
Here is a diagram that represents the data model.
The main tables are:
ProductivityByHour: Productivity data is centred around a 'workcenter' (essentially a machine that is performing the task). This table contains the primary hourly level productivity parameters.
CbmParametersByHour: Condition Based Monitoring (CBM) is the process of monitoring a key parameter in a workcenter (vibration, temperature etc.). This helps in locating a significant change which may be indicative of a developing fault in a machine. The table contains information about the CBM parameters, their control limits and details of violations.
ProcessParametersByHour: Process parameters are the parameters dependant on the part (temperature of Part-1, temperature of Part-2 etc.). This helps in identifying a significant change that may be indicative of developing a quality defect. The table contains information about the Process parameters, their control limits and details of violations.
PartProcessOperationByHour: The table contains Part - Operation information for each part at an hourly level.
*WorkcenterPartHourlyProdParamsFact: The table contains production parameter data at a part and hourly level. Production parameters are used to store the production quantity in different units based on Customer requirements.
e.g. Some customers want to measure production quantity in Batch Counts but for their internal assessment, they need Batch Weight. In such cases, MInt will show Batch Count and Batch Weight will be sent to their internal system (say the customer's ERP system).
UtilitiesByHour:
OperationEnergyByHour:
PartProductivityByHour:
Examples of using the object model to create a chart:
Here is an example video of how you can use the data model to analyze CBM Parameter Violations by Hour.
Checklists Data Model
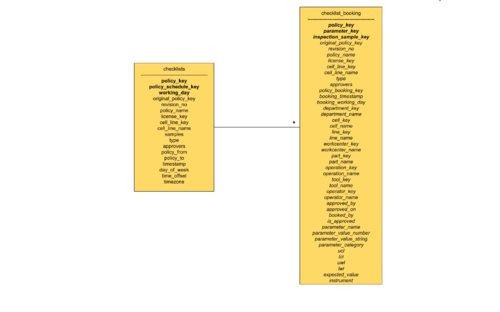
MInt Policy data gives information about your manual policy bookings. For e.g. Safety Checksheets, Part Dimension Checklists, etc. This data is then used for correlations with other process/ productivity parameters or to create dashboards from your manual booking data.
Here is a diagram that represents the data model.
The main tables are:
Checklists: The table contains policy master data along with the schedule of the policy booking.
ChecklistBooking: This table has the actual manually entered booking data for e.g. part length values, checklist values etc.


