Difference between revisions of "SQL Lab"
(Tag: Visual edit) |
m (Tag: Visual edit) |
||
| Line 23: | Line 23: | ||
The user also has an option to download the Query result as a CSV file for further analysis using ''''.CSV'''<nowiki/>' button at the top of SQL Query Output pane. | The user also has an option to download the Query result as a CSV file for further analysis using ''''.CSV'''<nowiki/>' button at the top of SQL Query Output pane. | ||
| − | === Example video for writing a SQL query and visualizing | + | === Example video for writing a SQL query and visualizing the results === |
Here is an example video of how you can write a SQL query and using the query output quickly visualize the data using a chart. | Here is an example video of how you can write a SQL query and using the query output quickly visualize the data using a chart. | ||
'''ADD VIDEO HERE''' | '''ADD VIDEO HERE''' | ||
Revision as of 06:14, 30 July 2020
Contents
[hide]About SQL Lab
SQL Lab is a modern, feature-rich SQL IDE. Using this, the user is able to look at his/ her data tables, create joins on existing tables, and can visualize these modified tables to get additional insights.
This can be accessed by going to 'SQL Lab' button present at the top of the Datonis BI toolbar or by clicking on the '+New' button and selecting 'SQL Query' at the top right of the page.
Components of SQL Lab
There are 3 components available that are explained below:
- SQL Editor - This is the IDE where-in the user can write his/ her own SQL queries.
- Saved Queries - Once the user has created the queries and he/ she wish to run the same query then he/ she can save the query and rerun it by accessing it in the 'Saved Queries' tab.
- Query Search - This feature lets the user search for his/ her queries by a user, database, and date of creation.
SQL Lab Usage
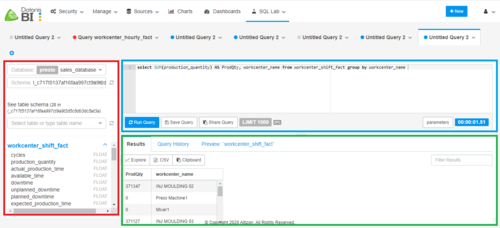
The SQL Query page gives the user a detailed look into his/her databases, the tables present for that database, and the SQL Query pane to write queries. There are 3 sections in the SQL Query page.
- Datasource/ Table Pane - marked in Red
- SQL Query Editor Pane - marked in Blue
- SQL Query Output Pane - marked in Green
For more details on how to create charts, please visit Create your own custom dashboards.
The user also has an option to download the Query result as a CSV file for further analysis using '.CSV' button at the top of SQL Query Output pane.
Example video for writing a SQL query and visualizing the results
Here is an example video of how you can write a SQL query and using the query output quickly visualize the data using a chart.
ADD VIDEO HERE

